The median GA4 engagement rate across all industries is 56%. Most marketing teams see that number, feel fine about it, and move on. They shouldn’t.
That single metric tells you almost nothing about whether your business will grow next quarter. It tells you that just over half your sessions lasted more than 10 seconds. That’s it. GA4 gives you hundreds of Google Analytics metrics to work with. The problem isn’t access — it’s that most teams report on metrics that feel informative but have no causal connection to revenue. Pageviews go up. Sessions increase. Total users looks healthy. And the business stalls anyway.
There’s one configuration change in GA4 that takes under two minutes and activates the entire predictive metrics suite: purchase probability, churn probability, revenue prediction. Most setups have never made it. That’s what separates a GA4 property generating insight from one generating reports.
What GA4 Measures Differently From Universal Analytics
GA4 isn’t Universal Analytics with a new interface. It’s a fundamentally different measurement system, and understanding the difference is the only way to read its metrics correctly.
Universal Analytics was session-based. Every visit started a session. Every action within that session was logged against it. The session was the primary unit of measurement, and bounce rate was the headline engagement signal. If someone loaded one page and left, that counted as a 100% bounce.
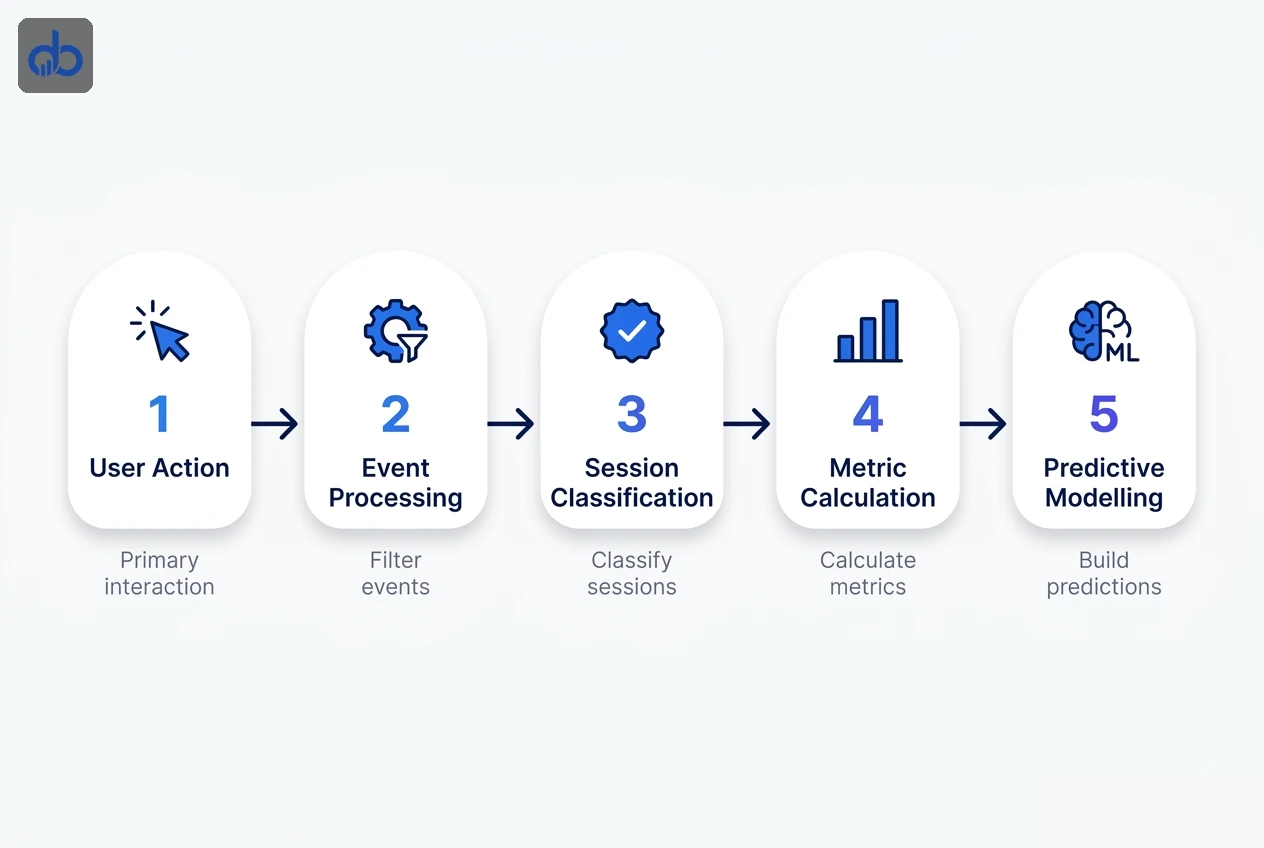
GA4 is event-based. Every user interaction — page load, scroll, click, form submission, video play — is a discrete event with its own parameters. Sessions still exist, but they’re derived from events, not the other way around. That changes what “engagement” actually means.
An engaged session in GA4 requires at least one of three conditions: the session lasted longer than 10 seconds, a conversion event fired, or the user triggered at least two page or screen views. That’s a meaningfully higher bar. A user who loaded your homepage, skimmed for 8 seconds, and left? Not engaged. Under Universal Analytics, that session would have been unremarkable. In GA4, it’s explicitly classified as non-engaged.
So when you look at your engagement rate in GA4 and compare it to your old UA bounce rate, stop. They don’t measure the same thing. A 55% engagement rate in GA4 isn’t equivalent to a 45% bounce rate in UA. The way Google Analytics metrics are defined and classified shifted entirely when GA4 replaced Universal Analytics.
The Metrics Most Teams Are Measuring Wrong
Here’s the dominant advice you’ll find across every GA4 guide right now: set up a dashboard tracking 11–15 metrics (total users, sessions, pageviews, engagement rate, event count, conversions) and you’ll have full marketing visibility. Here’s where that breaks down.
Pageviews, total users, and raw session counts are traffic proxies. They tell you how many people showed up. They don’t tell you whether those people represent demand for what you sell, whether the traffic source is sustainable, or whether users are moving toward a conversion. A 40% month-over-month traffic spike can mean your content is ranking. It can also mean a bot is crawling your site or one viral post attracted entirely the wrong audience.
49% of marketers already consider pageviews a vanity metric. The other 51% are still reporting it as a primary KPI.
The Google Analytics metrics that actually predict business growth are narrower and harder to set up. They require custom event tracking, proper conversion configuration, and in some cases enough conversion volume to activate GA4’s machine learning features. That’s the inconvenient reality most GA4 content glosses over, because explaining why your current setup is insufficient isn’t a popular message. But that’s exactly the gap that separates a GA4 property generating insight from one generating reports.
The Google Analytics 4 Metrics With a Direct Line to Revenue
These aren’t the most commonly tracked Google Analytics 4 metrics. They’re the ones with a measurable relationship with business outcomes rather than traffic volume.
1. Engaged Session Conversion Rate
Not conversion rate. Engaged session conversion rate. The difference matters. Standard conversion rate divides conversions by all sessions, including sessions where the user was barely present. Engaged session conversion rate divides conversions only by sessions that met GA4’s engagement threshold. It filters out noise. If this number is low despite strong traffic, you have a conversion problem, not a traffic problem — and those require completely different fixes.
2. First Visit Conversion Rate
GA4 segments conversion rates by user type. First visit conversion rate isolates new users specifically. For most B2B service businesses, it’ll sit close to zero — nobody hires an agency on their first visit. But it benchmarks intent quality. If it’s declining while traffic grows, you’re attracting increasingly unqualified visitors. That’s a channel or content problem worth catching early.
3. Key Event Rate by Channel
GA4’s key events (what UA called goals) can be segmented by acquisition channel in the Traffic Acquisition report. This shows which channel delivers users who actually do the things that matter: book a call, download a resource, request a proposal. A channel driving 10,000 sessions with zero key events is a cost centre dressed as a traffic source. You’d never see that in a sessions report.
4. Average Engagement Time per Engaged Session
This is a cleaner signal than average session duration because it excludes non-engaged sessions entirely. It measures the quality of attention from people who were genuinely present. For content-heavy sites, this predicts SEO performance: Google’s systems increasingly weight user satisfaction signals, and engaged time is the closest proxy available in GA4 right now.
5. Revenue per User
Once eCommerce events are configured, GA4’s Revenue per User shows average revenue generated per unique user over a period. Compare this across acquisition channels and you’ll immediately see which ones bring buyers and which bring browsers. A channel with high traffic but low Revenue per User isn’t a growth channel — it’s a brand awareness channel at best.
Expert Tip: The biggest setup mistake in GA4 audits is teams marking every form submission as a single conversion event. Newsletter signups, contact forms, quote requests, and demo bookings are not the same conversion. Assign different event names and different conversion values to each. Otherwise you're averaging down your entire pipeline into one number that tells you nothing about deal quality — and your attribution model learns from that flawed signal.
These five GA4 metrics don’t appear in a default installation. Every one requires specific event configuration and, in some cases, conversion volume thresholds before they activate.
Predictive Metrics: GA4’s Most Underused Capability
GA4 includes three predictive metrics built on Google’s machine learning: purchase probability, churn probability, and revenue prediction. These are the closest thing analytics has offered to forward-looking data rather than backward-looking reports. And yet most GA4 setups never activate them.
Calculates the likelihood that a user who visited your site in the last 28 days will complete a purchase in the next 7 days. Create a predictive audience from this metric and push it directly to Google Ads for remarketing — targeting users GA4 has already identified as high-intent before they click a competitor's ad.
Identifies users who visited in the last 7 days but are unlikely to return in the next 7 days. For subscription businesses and SaaS products, this is a direct early warning system. A re-engagement campaign triggered by high churn probability is more efficient than any broadcast email because the audience is pre-qualified by their own behaviour.
Forecasts expected revenue from active user segments over the next 28 days. This feeds directly into budget decisions. If predicted revenue from your current pipeline is declining, you need to increase acquisition spend before the revenue gap appears in your P&L, not after you've already missed the quarter.
Here’s the catch: predictive metrics require a minimum of 1,000 returning users triggering the relevant condition within the last 28 days. Most SMB websites don’t hit that threshold organically. Below it, the metrics simply won’t activate.
But for mid-market businesses with consistent traffic, this feature sits dormant while teams build manual dashboards tracking sessions and pageviews. One of the most commercially powerful features in modern analytics, sitting unused because nobody walked through the eligibility requirements.
- Purchase event configured and firing correctly
- 1,000+ returning purchasers in the last 28 days
- 1,000+ returning non-purchasers in the last 28 days
- GA4 property linked to Google Ads account
- Data retention set to 14 months (not the default 2 months)
Attribution in GA4: Why Your Channel Credit Is Probably Wrong
Your Google Analytics metrics for channel attribution are only as accurate as the attribution model applied to your property. Every GA4 property uses an attribution model. The default is GA4’s data-driven attribution. The fallback, for properties without enough conversion volume, is last click. Most teams don’t know which one they’re using, or what difference it makes to their budget decisions.
Last-click attribution gives 100% of conversion credit to the final marketing touchpoint before the conversion. So: someone discovers your brand via organic search, reads three blog posts over two weeks, clicks a LinkedIn ad, and then converts through a branded search. Last click credits the branded search campaign. Your SEO investment and your LinkedIn spend are invisible in the conversion data. Budget decisions built on this model systematically defund top-of-funnel channels while over-crediting retargeting.
GA4’s data-driven attribution uses machine learning to evaluate up to 50 user interactions across the 90 days before a conversion. It assigns fractional credit based on which touchpoints statistically influenced the outcome. In multi-touch accounts with strong organic presence, SEO typically gains 30–50% more attributed conversions under data-driven compared to last click. That’s not a small rounding error — it’s the difference between cutting your SEO budget and doubling it.
To qualify for GA4’s data-driven attribution, the property needs at least 400 conversions per month. Below that threshold, it defaults to last click. The fix isn’t to wait until volume grows — it’s to expand what you’re counting as a conversion. Micro-conversions (resource downloads, email signups, video completions) can be configured as key events and included in the attribution model. That raises your total event count above the threshold and gets you off last click.
Getting this model right isn't optional if you're making channel investment decisions based on GA4 data. Check your current model under Admin → Attribution Settings — most accounts have never looked at this screen.
| Model | How Credit Is Assigned | The Risk |
|---|---|---|
| Last Click | 100% credit to the final touchpoint | Defunds SEO, content, and awareness; over-credits retargeting |
| Data-Driven | ML-weighted across up to 50 touchpoints over 90 days | Requires 400+ conversions/month to activate |
Building a GA4 Setup That Actually Surfaces Growth Signals
Building your reports around the right GA4 metrics starts with event architecture. The gap between a GA4 property that generates insight and one that generates reports comes down to how that architecture is built.
Start with one question: what are the three to five actions on your website that, if a user takes them, genuinely predict they’ll become a customer? For a B2B service business, that’s typically viewing a case study or service page more than once, spending 90 seconds or more on a pricing page, and submitting a contact or proposal form. For eCommerce, it’s add-to-cart, checkout initiation, and purchase.
Configure those as key events. Assign conversion values where possible, even rough ones. A completed proposal form might represent a £3,000 average deal value. A newsletter signup represents £0 in immediate pipeline. The difference matters for attribution modelling.
Then connect GA4 to Google Ads via the account link. This gives you two things: the ability to use GA4 predictive audiences in remarketing campaigns, and the ability to import GA4 key events as Google Ads conversion actions. When your ad platform and your analytics platform share the same conversion definition, budget decisions and reporting finally align.
One more thing: check your data retention settings. GA4 defaults to 2 months of user-level data retention. For any business doing month-over-month cohort analysis or lifetime value reporting, change this to 14 months in Admin → Data Settings → Data Retention. It’s a two-minute change that most teams never make.
Expert Tip: Don't let GA4's Explore section stay blank. Build a Funnel Exploration for your primary conversion journey — the exact sequence of pages or events from first visit to key event completion. A funnel report shows you precisely where users drop off. It's the most useful report GA4 produces and the first thing our analytics team builds in every new property. Most teams never open it.
Stop Reporting on Traffic. Start Reporting on Revenue.
You can now distinguish the Google Analytics 4 metrics that predict revenue from the traffic proxies most setups report on, and you have the specific configuration steps to surface them. The implementation gap is real: custom event mapping, attribution threshold management, and predictive feature eligibility require configuration changes most GA4 setups have never made. Our analytics and tracking setup service audits your current event architecture and rebuilds reporting around signals that actually matter.
- Replace session CVR with engaged session CVR as your primary conversion efficiency metric — it filters out low-quality traffic and reveals true landing page performance
- GA4's predictive metrics require 1,000+ returning users with purchase events in the last 28 days — check whether your property qualifies before building audiences from them
- Data-driven attribution requires 400+ conversions per month; properties below that default to last-click, which systematically undercredits SEO and content marketing
- Change GA4 data retention from the default 2 months to 14 months in Admin — this two-minute setting determines whether cohort and LTV reporting has any usable data
- Configure key events with conversion values, not just event names — GA4's attribution model learns from signal quality, and a newsletter signup dilutes your pipeline data the same as a proposal submission if they share an event
Frequently Asked Questions
What is the difference between GA4 metrics and dimensions?
A metric is a quantitative measurement: sessions, conversions, revenue. A dimension adds context to that number: channel, country, device, landing page. Metrics without dimensions tell you very little. "500 conversions" is a number. "500 conversions from organic search on mobile to your pricing page" is something you can actually act on.
How many conversions do I need for GA4 data-driven attribution?
Google requires a minimum of 400 conversions per month, with 600–1,000 recommended for optimal model accuracy. If you're below that threshold, expand your conversion tracking to include micro-conversions to reach the minimum and stop defaulting to last-click attribution.
What is a good engagement rate in GA4?
The median across all industries is 56%. B2B service businesses typically land between 52–63%, while B2C averages closer to 71%. Engagement rate is most useful tracked over time within your own property and segmented by channel, not benchmarked in isolation against broad averages.
Can GA4 work for small businesses without eCommerce tracking?
Yes, but you need to configure key events manually. Without purchase events, GA4's predictive metrics won't activate and revenue attribution won't work. For service businesses, configure your primary contact or proposal form as a key event with an estimated conversion value. That gives GA4 enough signal to model attribution and eventually activate predictive features as volume grows.