
Eighty-four percent of global marketers say they feel confident measuring ROI. According to Nielsen’s 2024 Annual Marketing Report, only 38% actually do it across all channels. That gap between the feeling of measurement and real accountability is exactly where most PPC budgets quietly disappear.
The issue isn’t a shortage of data. Google Ads, Meta, and Microsoft Advertising produce hundreds of metrics per campaign. The issue is that most teams track the wrong ones, or track the right ones without connecting them to each other. Clicks, impressions, and even conversions can all trend upward while revenue stays flat.
This article lays out a three-tier framework for PPC campaign success metrics that gives every number a defined role. Each tier answers one question. Each metric points to a specific decision. The goal is to move from dashboard watching to genuine PPC performance measurement.
Why Platform Metrics Alone Are Not Enough
Picture a campaign with a 6% click-through rate, a $1.80 cost per click, and a 4% conversion rate. Inside any ad dashboard, that looks like a win. But if those conversions are low-intent form fills from people who never return a sales call, your campaign is destroying budget at a predictable rate.
Platform metrics measure what happens inside the ad platform. They say nothing about what happens once a lead enters your CRM, speaks to a sales rep, or quietly churns three months after purchase. That’s a wide blind spot for something you’re paying for every day.
This disconnect has real business consequences. Viant found that 36% of CFOs cite the use of vanity metrics by marketing leaders as a top concern about their teams. It’s not that marketers are lazy. It’s that clicks, impressions, and even cost per acquisition can look healthy while the business is losing money per customer.
Impressions show reach. Clicks show interest. Neither shows revenue.
PPC campaign analytics that stop at the platform boundary leave the most important questions unanswered: Who converted? Did they buy? Did they stay?
The three-tier framework below closes that gap.
The Three-Tier PPC Success Measurement Framework
Most PPC guides present metrics as a flat list. CTR, CPC, CPA, ROAS, and Quality Score are each useful individually, but none are organised around the decisions they should inform.
Here’s the problem with that approach: when every metric looks equally important, you optimise for the wrong things. And you usually don’t find out until the quarter’s over.
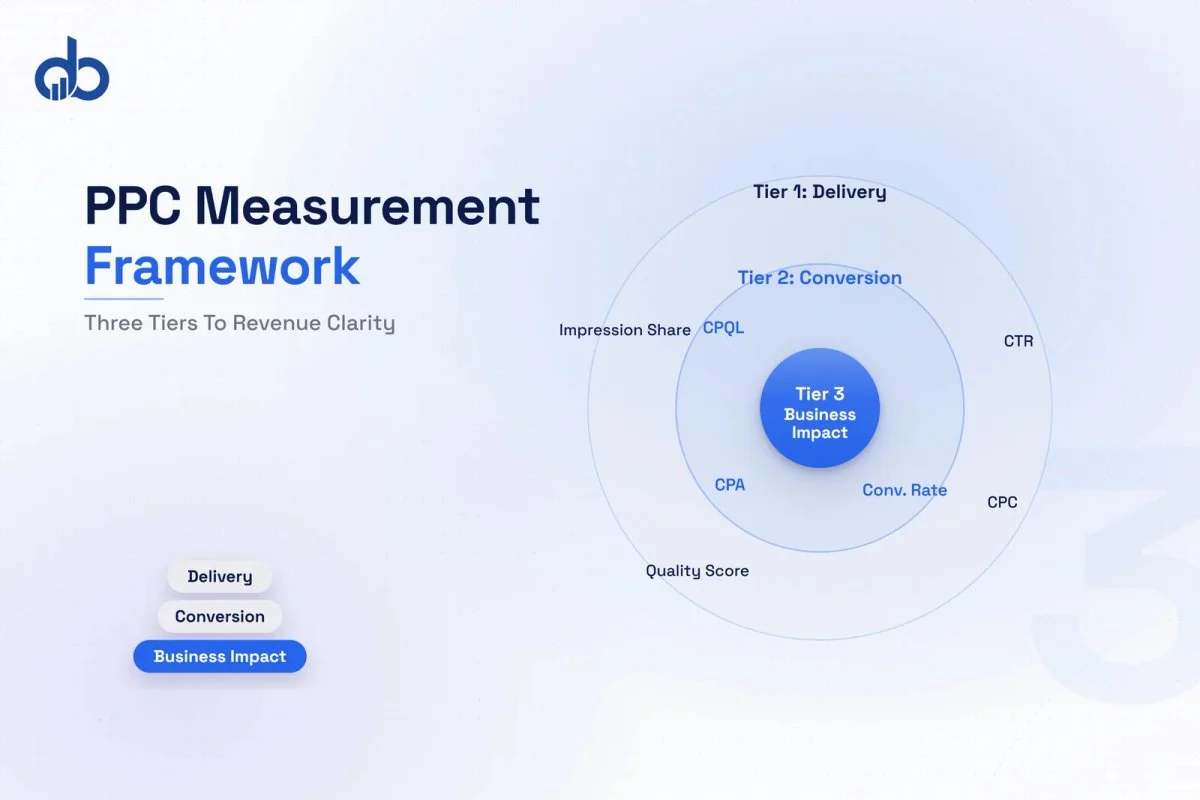
A tiered framework changes that. Each tier handles a specific layer of performance, and each layer feeds the next. You can’t accurately interpret Tier 3 (business impact) without first understanding what’s happening in Tier 1 (delivery) and Tier 2 (conversion). PPC performance measurement only becomes actionable when all three layers connect.
Tier 1 — Delivery Health: Are the right people seeing the ads at a sustainable cost?
Tier 2 — Conversion Efficiency: Are those people taking the intended action?
Tier 3 — Business Impact: Is that action generating commercial value?
The critical insight: optimising one tier in isolation can actively damage another. Lowering CPC by shifting to broader match types may improve delivery health metrics while sending unqualified traffic that collapses conversion rate and drives up customer acquisition cost. Platform metrics look fine. The business pays for it.
That’s the core problem with standard PPC campaign success metrics guidance. It presents metrics as a checklist rather than a connected hierarchy.
Running PPC without a measurement framework tied to revenue? Get Free Marketing Audit
Tier 1: Delivery Health Metrics
Delivery health tells you whether your campaign is reaching the right audience at a reasonable cost. These are the metrics most PPC managers review most frequently, and they should be — but only as diagnostic signals, not as success indicators.
Click-Through Rate (CTR)
CTR is clicks divided by impressions, expressed as a percentage. A rising CTR usually means your ad copy or targeting is connecting with the audience. A falling CTR signals a mismatch somewhere: the ad, the audience, or both.
What CTR doesn’t tell you is whether those clicks came from buyers. A highly clicked ad aimed at an unqualified audience produces great CTR and terrible PPC KPI outcomes at every downstream tier. It’s one of the most common ways ad spend quietly disappears without anyone flagging it.
Cost Per Click (CPC)
CPC is total ad spend divided by total clicks. It reflects the market price of the traffic your campaign attracts. CPC is driven by Quality Score, bid competition, and the intent level of the keyword.
Lower CPC isn’t always better. Keywords with lower competition often have lower commercial intent, meaning cheaper clicks from people less likely to convert. That’s a trap worth knowing about before you start optimising toward the cheapest available traffic.
Quality Score
Quality Score is Google’s rating of how relevant your keyword, ad, and landing page are to each other. It’s the compounding metric in paid search. A higher Quality Score lowers your effective CPC and improves your ad position relative to competitors bidding the same amount. It has three components: expected CTR, ad relevance, and landing page experience.
Improving Quality Score by aligning the keyword, ad headline, and landing page content around a single intent is a widely documented high-return optimisation in PPC campaign analytics.
Impression Share
Impression Share shows what percentage of eligible impressions your ad captured. Google breaks it into two loss buckets: Lost IS (Budget) means you ran out of money. Lost IS (Rank) means competitors outbid or outscored you.
Each has a different fix. Misdiagnosing which one is driving the loss leads to the wrong solution. If you cut bids when you should be improving Quality Score, you’ll make things worse before you make them better.
Delivery health metrics tell you traffic is arriving. Tier 2 tells you whether that traffic converts.
Tier 2: Conversion Efficiency Metrics
Conversion efficiency answers whether the traffic arriving from your ads is taking the action you need. Strong Tier 1 metrics combined with weak Tier 2 metrics point to a post-click problem: either the landing page isn’t delivering what the ad promised, or the audience segment is wrong.
Conversion Rate
Conversion rate is conversions divided by clicks, multiplied by 100. WordStream’s 2025 benchmark data shows the average Google Ads conversion rate for search campaigns across all industries sits at 3.75%. That’s a reference point, not a target. A direct-to-consumer ecommerce brand and a B2B software company should have very different conversion rate expectations.
The most useful version of this metric is split between campaign-level conversion rate and landing page conversion rate. A campaign may send qualified traffic to a landing page that underperforms. The campaign isn’t the problem. The page is.
Cost Per Acquisition (CPA)
CPA is total ad spend divided by number of conversions. It tells you what you’re paying for each conversion event: whether that’s a lead form, a purchase, a call, or a trial signup.
The common mistake with CPA is treating the industry benchmark as the optimisation target. The right CPA target is calculated from the maximum CAC your unit economics can support, not from what competitors pay. If your average customer generates $2,000 in gross margin, your target CPA should be anchored to that number, not to whatever Google’s recommendation tool suggests.
Cost Per Qualified Lead (CPQL)
For lead generation campaigns, Cost Per Qualified Lead is a more actionable metric than raw Cost Per Lead. CPL measures volume. CPQL measures quality.
If a campaign generates 100 leads at $40 each but only 8 pass the sales team’s qualification criteria, your true CPQL is $500. A different campaign generating 40 leads at $80 each with a 30% sales acceptance rate has a CPQL of $267 — objectively better despite the worse headline CPL number. Most people don’t run that calculation. They should.
One of our Performance Marketing clients, a B2B services company, had a campaign running a 5.2% conversion rate and strong impression share. When we connected platform data to their CRM outcomes, CPQL was 3.4 times their target threshold. The platform looked healthy. The pipeline told a different story.
To calculate CPQL, export all leads generated from PPC in a given month from your CRM, filter to those marked "sales-accepted" or "qualified," then divide total ad spend by that filtered count. Track it weekly, not monthly, so you catch lead quality shifts before they become pipeline problems.
Tracking CPQL requires connecting platform conversion data to CRM outcomes. That connection is the minimum infrastructure for real PPC ROI measurement. Digiblazon’s Analytics & Tracking service helps set up the attribution layer between your ad platform and CRM so this number is always current.
Tier 2 tells you conversions are happening. Tier 3 tells you if they’re profitable.
Tier 3: Business Impact Metrics
Business impact metrics live outside the ad platform. They require data from your CRM, finance tools, or customer success system. They’re the hardest to set up, the slowest to populate, and the only ones that actually answer whether PPC is generating commercial value.
Return on Ad Spend (ROAS) vs Return on Investment (ROI)
ROAS is revenue divided by ad spend. A campaign generating $16,000 in revenue from $2,000 in spend has an 8:1 ROAS. Google’s Economic Impact data suggests businesses generate an average of $8 in revenue for every $1 spent on Google Ads, though averages obscure the wide variance across industries and margin profiles.
The important distinction: ROAS measures revenue. ROI measures profit. A high-ROAS campaign selling low-margin products can still be unprofitable. PPC ROI measurement requires knowing gross margin, not just revenue. That distinction gets expensive when it’s missed.
Customer Acquisition Cost (CAC)
CAC is the total cost of acquiring a new customer, including all marketing and sales costs attributed to that acquisition. PPC contributes to CAC as one channel in the acquisition mix.
The target CAC is defined by the LTV:CAC ratio the business needs to sustain. A 3:1 LTV:CAC ratio is commonly cited as a minimum threshold, meaning every $1 spent acquiring a customer should return at least $3 in lifetime value. But the right ratio depends on payback period requirements and your capital efficiency model. There’s no universal answer, and targets borrowed from industry averages usually miss the actual constraint.
Lifetime Value (LTV)
LTV is the total revenue a customer generates over the course of their relationship with the business. In a subscription model, LTV is monthly recurring revenue multiplied by average contract length. For one-time purchase models, it includes repeat purchase rate and average order value.
LTV is the number that makes high CPA campaigns viable. If a customer is worth $8,000 over three years, a $600 CPA is reasonable. The same CPA would be unsustainable for a product with a $400 average order value and no repeat purchase rate. PPC KPI targets without LTV context are built on guesswork.
Payback Period
Payback period is how many months it takes to recover the CAC from revenue generated by that customer. Shorter payback periods mean better cash flow and lower risk. For subscription businesses, a 12-month payback period is commonly accepted. For ecommerce, the bar is typically lower.
Payback period connects directly to bidding strategy. A business with a 6-month payback period can afford more aggressive CPA targets than one recovering spend over 24 months. That difference changes how you should structure your campaigns, your bids, and your conversion targets.
Not sure your PPC spend is connecting to revenue? Get Free Marketing Audit
Building Your PPC Dashboard: Reporting Cadence and Metric Ownership
Not every PPC campaign success metric should be reviewed at the same frequency. Daily review of CAC data is noise. Weekly review of impression share is overkill for an established campaign. A structured cadence assigns each metric to the right interval and the right owner.
Daily Review — Delivery Health
Check budget pacing (are you spending evenly or front-loading?), CTR changes, CPC shifts, and any Quality Score alerts. Daily review should take 10–15 minutes. The goal is to catch budget waste or delivery failures before they compound.
Weekly Review — Conversion Efficiency
Review conversion rate by campaign and ad group, CPA trends, and CPQL from CRM data. Your weekly PPC campaign analytics review should also flag landing pages with significant drop-off from the previous week. This is where you identify and fix post-click problems.
Monthly Review — Business Impact
Review ROAS, blended CAC, LTV trends, and payback period changes. Monthly review is where PPC ROI measurement connects to finance. Include your revenue operations lead or CFO in this review. It’s the moment where PPC becomes a business conversation rather than a marketing one.
Set metric alert thresholds in your reporting tool: not just absolute values, but percentage change from a 14-day rolling average. A CTR that drops 20% in two days is a delivery signal. A CPA that creeps up 8% per week over a month is a quality signal. Alerts catch both patterns before they become expensive.
Metric Ownership
Delivery health is owned by the PPC manager. Conversion efficiency is a shared responsibility between PPC and the landing page or product team. Business impact metrics are owned by marketing leadership and reviewed with finance.
Assigning clear ownership prevents the most common failure mode: everyone looks at the dashboard, no one is accountable for the number.
Common questions we hear on calls:
“How do I get my finance team to take PPC reporting seriously?”
Start the monthly review with Tier 3 data, not a slide deck of impressions and clicks. When you walk in with ROAS connected to gross margin and CAC benchmarked against LTV, you’re speaking their language. Most PPC teams lose the finance audience in the first five minutes by leading with platform metrics that don’t map to business outcomes. Flip the order.
“What’s the minimum setup before we can track CAC and LTV accurately?”
You need a CRM that captures lead source at acquisition, basic revenue tagging by customer cohort, and at least three to four months of customer history to calculate initial LTV estimates. Without CRM integration, you’re calculating CAC from ad platform data alone. That number will always look better than it is.
When Numbers Look Good but Results Do Not Add Up
Platform optimisation and business optimisation can diverge. This is an underappreciated risk in PPC, and one of the most expensive to miss.
Three warning signs that the tiers have separated:
CPA drops but CPQL rises. A campaign that optimises toward cheaper conversions often does so by reaching a broader, less-qualified audience. The PPC KPI improves. The sales team starts complaining that leads are getting worse. Both observations are correct.
ROAS improves but LTV falls. Smart bidding algorithms optimise for immediate conversion value. If that optimisation selects for customers with high initial purchase values but low retention rates, ROAS looks better while your customer base erodes in quality.
Conversion rate rises but pipeline stays flat. A landing page change that increases form fills without improving lead intent is a conversion rate improvement and a pipeline problem at the same time. The PPC campaign analytics show green. The sales forecast stays flat.
The diagnostic for all three: compare tier metrics side by side across a 90-day window. If Tier 1 and Tier 2 improve while Tier 3 stagnates or declines, the optimisation is happening at the wrong layer.
Set alerts when Tier 2 and Tier 3 PPC campaign success metrics diverge from their 30-day baseline by more than 15%. That threshold catches problems early enough to investigate before the impact becomes significant.
Conclusion
Tracking platform metrics without connecting them to business outcomes isn’t PPC performance measurement. It’s reporting. The three-tier framework turns PPC campaign success metrics into a decision layer: delivery health tells you if ads are reaching the right people, conversion efficiency tells you if they’re taking action, and business impact tells you if that action is worth the spend. When all three tiers are wired together, your campaigns stop optimising for dashboard numbers and start generating qualified pipeline. Digiblazon’s Performance Marketing team builds and manages the measurement infrastructure that connects all three layers. Get Free Marketing Audit.
- Platform metrics like CTR, CPC, and even CPA can all trend upward while revenue stays flat — they measure what happens inside the ad platform, not commercial outcomes.
- The three-tier framework organises PPC metrics into delivery health, conversion efficiency, and business impact, each answering a specific question and feeding the next tier.
- ROAS measures revenue; ROI measures profit — a high-ROAS campaign selling low-margin products can still lose money without gross margin context.
- Cost Per Qualified Lead (CPQL) is more actionable than raw CPL for lead generation because it connects platform performance to sales pipeline quality.
- Review delivery health daily, conversion efficiency weekly, and business impact monthly with clear metric ownership to prevent accountability gaps.
Frequently Asked Questions
What is the most important PPC success metric?
For most businesses, ROAS and CAC are the metrics most directly tied to commercial outcomes. CTR and CPC matter for diagnosing delivery problems, but they don't tell you whether PPC spend is generating profitable revenue. For lead generation campaigns, Cost Per Qualified Lead is often the most actionable metric because it connects platform performance to sales pipeline quality.
How often should I review PPC campaign metrics?
Delivery metrics such as CTR, CPC, and impression share should be reviewed daily or every two days to catch budget waste or delivery failures early. Conversion metrics such as conversion rate, CPA, and CPQL work best on a weekly review cycle. Business impact metrics such as ROAS, CAC, and LTV require monthly review because downstream sales data takes time to accumulate.
What is a good ROAS for PPC campaigns?
ROAS benchmarks vary significantly by industry and margin structure. A 4:1 ROAS is often cited as a minimum target, but businesses with lower gross margins need higher ROAS to be profitable, and those with higher margins can sustain lower ratios. Set your ROAS target by working backward from gross margin and acceptable payback period, not from what industry averages suggest.
How do I measure PPC ROI when leads take months to close?
Use leading and lagging indicators together. Leading indicators including conversion rate, lead quality score, and sales acceptance rate from your CRM give early signals while the sales cycle runs. Lagging indicators including closed revenue, CAC, and LTV confirm whether early signals translated to real outcomes. A 30-day cohort analysis, grouping leads by acquisition month and tracking their progression, lets you compare campaigns on a consistent basis even with long sales cycles.