
Twenty-three percent of small business owners say their number one marketing frustration is not knowing what’s actually driving results. They’re running Google Ads, posting on social, sending emails, investing in SEO. When someone asks what’s working, the honest answer is a shrug.
The data exists. It’s sitting inside five different platforms, none of which talk to each other. Conversion data lives in Google Ads. Email open rates live in the email platform. Website behavior lives in Google Analytics. Lead pipeline lives in a spreadsheet. Nobody connected them, so nobody knows which channel closed the last 10 customers.
One of the five marketing dashboard tools in this article will save you 30 minutes a week. One will tell you whether your content budget is actually working. And one is free, installs in 10 minutes, and is the reason the other four actually function. What each tool does is distinct, and that distinction is what most guides on this topic miss entirely.
Why Most Small Businesses Are Flying Blind on Marketing Data
Fifty-six percent of small business owners spend an hour or less per day on marketing. That constraint shapes everything about how they use, or ignore, the data that’s already being collected.
The problem isn’t missing data. It’s fragmented data.
GA4 is logging every session. Meta Ads is recording every impression. The email platform is tracking open rates. None of it is in one place, and pulling it together manually takes time most owners don’t have. So decisions get made on gut feel, the most recent invoice, or whichever metric looks good in the platform’s own weekly email.
That pattern explains why only 30% of CMOs are confident in their ability to measure marketing ROI. If experienced marketing professionals can’t close that gap, it’s not a knowledge problem. It’s a tooling problem.
Signs you need marketing dashboard tools:
- You have no idea which channel sent your last 10 customers
- You check Google Ads and GA4 separately and the numbers never agree
- Your weekly “marketing review” is just looking at what got posted
- You know your ad spend but not your cost per lead
- You’ve published 10+ pieces of content and don’t know if any of them rank
If two or more of those apply, marketing analytics setup isn’t optional. It’s the fix.
Do You Need One Tool or a Stack?
Here’s what most guides on marketing dashboard tools get wrong: they frame the decision as “pick one platform that does everything.” That framing leads small business owners straight toward the wrong purchase.
No single platform covers web analytics, SEO intelligence, and Customer Relationship Management (CRM)-connected lead tracking equally well. GA4 is excellent at web behavior, but it tells you nothing about where your leads are in the sales pipeline. HubSpot tracks leads and email performance, but it doesn’t show keyword rankings. Semrush shows which keywords are driving organic traffic, but it can’t tell you what those visitors did after they landed on your site.
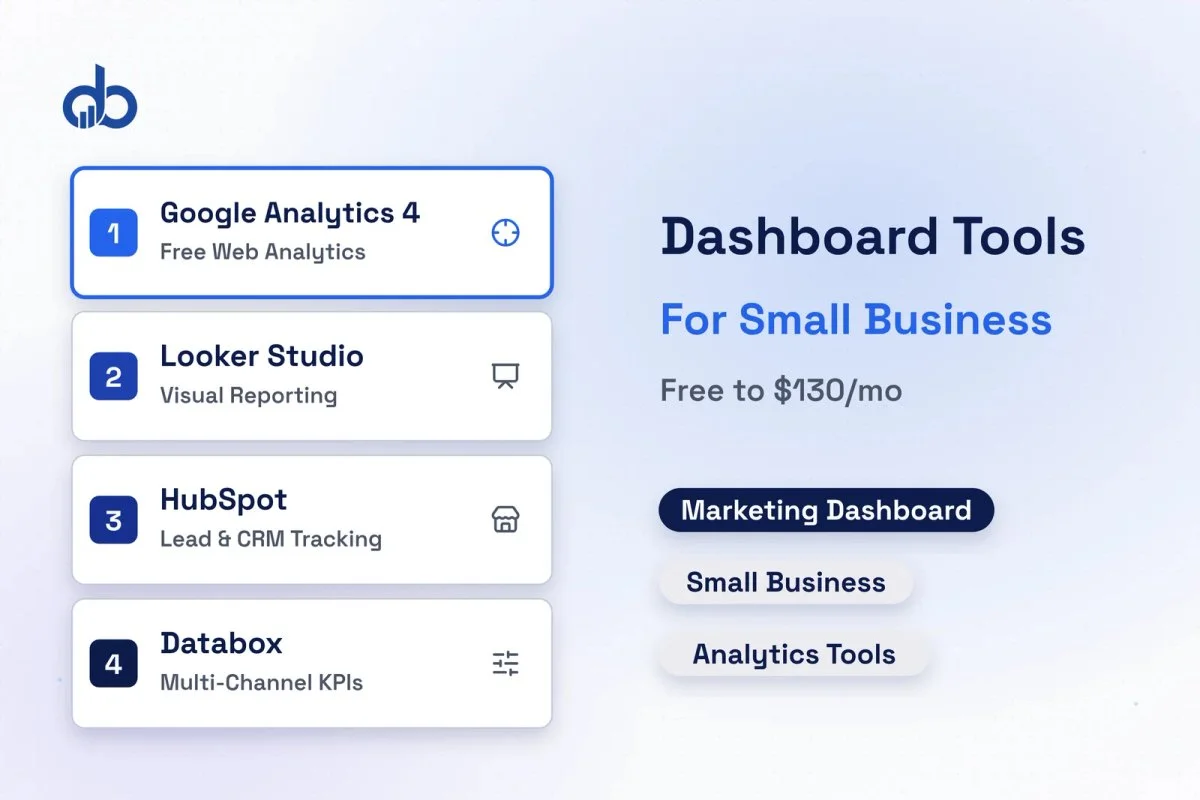
For small business marketing, a purposeful 2 to 3 tool stack is the real answer: each tool filling a job the others can’t. The five digital marketing dashboard tools in this article cover five distinct jobs:
| Tool | Job it does |
|---|---|
| Google Analytics 4 | Web behavior, traffic sources, conversions |
| Google Looker Studio | Visual reporting layer over your Google data |
| HubSpot | Lead tracking and CRM-connected marketing analytics |
| Databox | Consolidated KPI dashboard across all channels |
| Semrush | SEO rankings, competitor intelligence, organic visibility |
One real limitation of this approach is worth naming upfront: building the stack takes 2 to 4 hours of initial setup. It only generates value if you review it consistently. A weekly 30-minute dashboard review turns these tools into a decision engine. Without that habit, even the best digital marketing dashboard becomes a login you forget about. Start with one tool, get the review habit right, then add the next.
Tool 1: Google Analytics 4, The Non-Negotiable Foundation
Best for: Every small business with a website
Pricing: Free
No small business marketing stack starts anywhere else. Google Analytics 4 is the web behavior layer: it shows you where visitors come from, what they do on your site, and whether any of it converts.
GA4 replaced Universal Analytics in 2023. The core shift matters. Instead of tracking page views, GA4 tracks events. Every button click, form fill, scroll depth, video play, and purchase is an event. That makes conversion tracking more granular and more accurate than what most small businesses had before.
The exploration reports inside GA4 handle a lot of what you’d otherwise need a separate tool for. Funnel exploration, user lifetime, path exploration. You can see exactly which traffic source produced your converting visitors and which produced people who bounced immediately.
Without GA4 as your foundation, every other tool in this stack has a data gap. Looker Studio reports on GA4 data. Databox pulls from it. Even Semrush’s position tracking only tells half the story unless you can connect rankings to what visitors actually did on your site.
GA4 Setup Checklist: 5 things to verify before you trust the data
- Enable enhanced measurement (scrolls, clicks, video, file downloads, tracked automatically)
- Create at least one conversion event (form submit, purchase, or phone click)
- Connect GA4 to Google Ads and Search Console
- Set data retention to 14 months (the default 2 months is too short for year-over-year comparison)
- Exclude your own IP address from tracking
When to upgrade: GA4 is free indefinitely. Move to Looker Studio, also free, when you want visual reports that don’t require navigating GA4’s interface every time you need a number.
Our Analytics & Tracking service helps small businesses set up GA4 correctly from the start. Incorrect event configuration means your conversion data is wrong from day one, and decisions built on bad data cost more than the tracking setup itself.
Tool 2: Google Looker Studio, Turn Raw Data Into Readable Reports
Best for: Businesses using Google Ads and GA4 who want visual reports without a developer
Pricing: Free (Pro version at $9/user/month for collaboration features)
GA4 is powerful. Its interface, though, isn’t built for weekly reviews. Looker Studio is.
It’s a free drag-and-drop dashboard builder that connects to GA4, Google Ads, Search Console, Google Sheets, and 300+ community connectors, turning all of it into visual reports that update automatically. Build a dashboard once and it stays current. No more exporting CSVs, no more copying numbers into slides, no more explaining what a “dimension” is.
For a business running Google Ads alongside organic SEO, a single Looker Studio report can show:
- Total sessions by channel (organic, paid, social, email) over the last 28 days
- Which campaigns produced conversions vs. which burned budget without converting
- Which organic pages are driving the most engaged visitors
- Month-over-month traffic trends without any manual calculation
A practical starting point: Connect GA4, Google Ads, and Search Console in Looker Studio. Set the default date range to last 28 days. Add a session-by-channel chart, a conversion scorecard, and a top-pages table. That single dashboard replaces most of the manual reporting small business owners do now.
Looker Studio does have real limits. You’re capped at 5 blended data sources per report and 50 charts per page. For businesses pulling from more than 5 sources (Meta Ads, LinkedIn, HubSpot, Shopify, Mailchimp), the community connectors often break or introduce data lag. That’s when Databox becomes the better choice.
When to upgrade: Move to Databox when you regularly need data from four or more non-Google sources in a single view.
Tool 3: HubSpot Marketing Analytics, Track Leads, Not Just Clicks
Best for: Service businesses, B2B, and companies where the sale takes multiple touchpoints
Pricing: Free CRM tier; Marketing Hub Starter at $20/month
GA4 tells you how visitors arrive and what they click. HubSpot tells you what happens after. Whether that person became a lead, how the team followed up, and whether they eventually closed.
That distinction matters more than most small business marketing setups account for. An ad campaign that produces 500 clicks and zero closed deals isn’t performing well, no matter what the platform dashboard says. HubSpot bridges the gap between marketing activity and CRM outcomes: email opens, form fills, and page visits connected to lead stage, deal value, and close date.
The free tier covers:
- Contact database with full activity timeline (every email, form, and page visit per contact)
- Email marketing with open rate and click tracking
- Form analytics (which forms convert, which pages host them, where leads drop off)
- Deal pipeline tracking: see where every lead is in your sales process
- Dashboard with basic traffic, leads, and revenue attribution
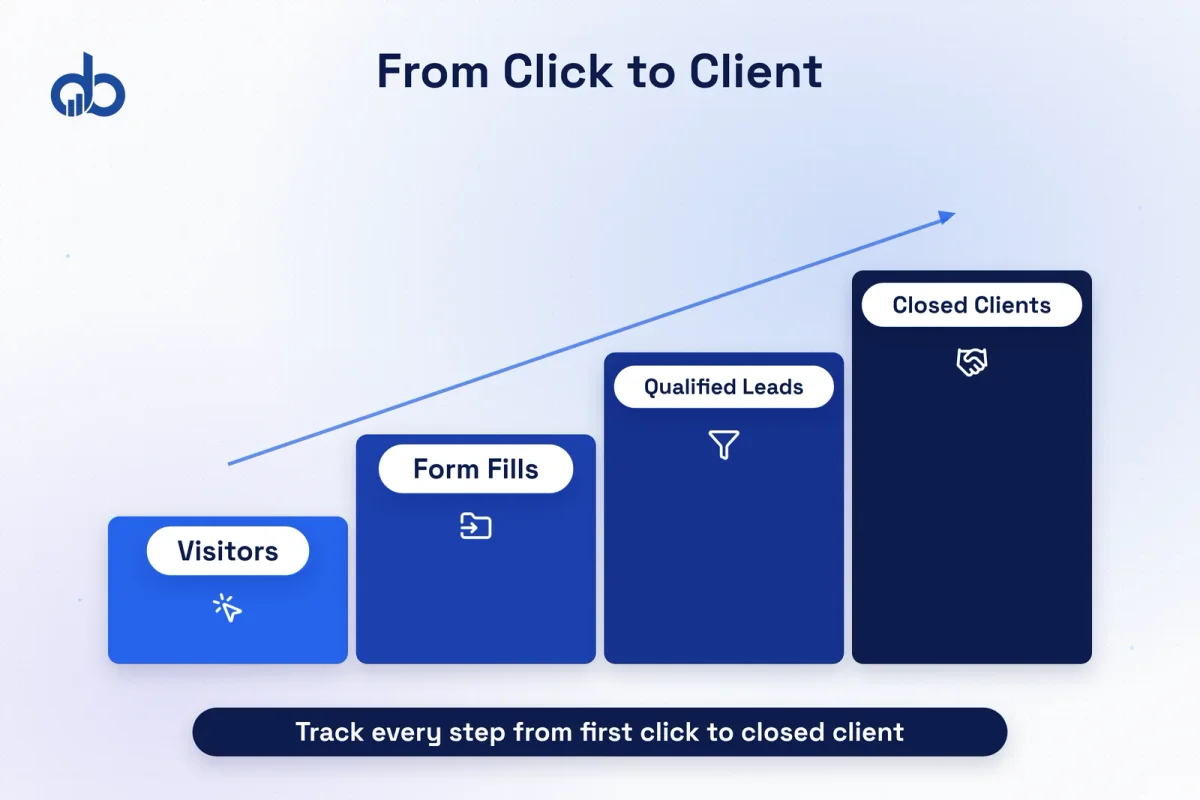
For a small service business, this is more useful than any paid ad reporting tool. Knowing that your Google Ads campaign sent 80 visitors, 12 filled out the contact form, 4 became qualified leads, and 2 became clients. That’s the number your decisions should be built on, not impressions or CTR.
Where HubSpot doesn’t help: ad spend optimization. It shows which ads produced contacts, but it doesn’t give you the granular bid and audience data you need to optimize spend. Use GA4 and Looker Studio for ad performance. Use HubSpot for lead quality and pipeline.
When to upgrade: From free to Starter ($20/month) when you want email automation sequences and more advanced marketing analytics reporting. The free tier is genuinely useful for at least 6 months before most businesses hit its ceiling.
Tool 4: Databox, One Screen for Every Marketing Channel
Best for: Small businesses running 3 or more paid channels who want one consolidated view
Pricing: Free tier (3 data sources, 1 dashboard, 3 users); paid plans from $159/month
Databox solves a specific problem: you run Google Ads, Meta Ads, and email campaigns, and every morning you log into three separate platforms to check performance. Databox pulls all of it into one consolidated marketing dashboard that updates in real time.
The platform connects to 130+ sources: GA4, Google Ads, Meta Ads, HubSpot, Shopify, Mailchimp, Stripe, LinkedIn Ads, and dozens more. It also has 300+ pre-built dashboard templates, so instead of building from scratch, you select “Google Ads Performance” or “eCommerce Revenue” and your data populates in minutes.
Three things that make Databox worth the investment:
Pre-built templates: A small business owner who has never built a marketing analytics dashboard can go from signup to a working multi-channel view in under 30 minutes. It’s the fastest setup path in this stack.
Metric alerts: Set a threshold: notify me if my ad CTR drops below 1.5%, alert me if email open rates fall below 20%. Databox sends a notification, so you catch problems before they drain a week of ad budget.
Mobile dashboard: The app updates in real time and is actually usable on a phone. Checking KPIs between meetings is practical here in a way that logging into GA4 on mobile never is.
The free tier is worth knowing about: 3 data sources and 1 dashboard is genuinely too limited for a business managing 4+ channels. Paid plans are a real monthly commitment. The right time to invest is when you’re spending 30 or more minutes per week pulling and combining numbers from multiple platforms manually. Databox pays that time back.
When to upgrade: From free to paid when you need more than 3 data sources or multiple dashboards for different channels.
Tool 5: Semrush, The SEO and Competitive Intelligence Dashboard
Best for: Small businesses investing in content marketing and organic search
Pricing: Pro plan at $129.95/month; $117.33/month on annual billing
The four tools above cover paid ads, email, and web analytics. Semrush covers the channel they all miss: organic search. It’s the digital marketing dashboard for keyword rankings, competitor visibility, and SEO site health. None of which GA4 or Looker Studio can show you.
What Semrush provides that nothing else in this stack delivers:
- Daily keyword ranking positions for every page on your site
- Which competitors rank for your target keywords, and what their content looks like
- Technical SEO issues (broken links, slow pages, missing meta descriptions) that drag down rankings
- Backlink profile: who links to you, who links to competitors, where the gaps are
- Traffic analytics: estimated organic and paid traffic for any competitor domain
For a small business publishing content to generate organic leads, Semrush is the tool that tells you whether that investment is compounding or flatlined. Without it, content marketing is a long-term bet with no progress signal for months.
What to review weekly in Semrush:
- Position Tracking: your top 20 target keywords and their ranking direction (up, flat, down)
- Top pages by organic traffic: which pages are gaining visitors, which are losing them
- New competitor keywords: keywords competitors recently started ranking for that you don’t cover yet
At $129.95/month, Semrush is the most expensive tool here. It’s not essential until you have a content program running. Start with tools 1 through 3, all free or nearly free. Add Semrush when you’ve published at least 10 pieces of content and need to know whether they’re actually moving.
How to Build Your Dashboard Stack (Not All 5 at Once)
The biggest mistake with small business marketing dashboard tools is trying to set everything up at once. Here’s the sequence that works.
Week 1: Free foundation
Install GA4. Create one conversion event. Connect it to Looker Studio and build your first report: traffic by channel plus conversion summary. Cost: $0. Time: 3 hours.
Month 1: Lead visibility
Set up HubSpot free CRM. Connect your contact forms so every submission becomes a contact record. Link HubSpot to GA4. Now you can see which traffic source produces contacts, not just clicks. Cost: $0. Time: 2 hours.
When you’re running ads on 3+ channels: consolidation
Add Databox. Connect GA4, Google Ads, and Meta Ads. Use a pre-built template. Set up 2 or 3 metric alerts. Cost: $159/month. Time: 30 minutes to a working dashboard.
When you have a content program running: SEO visibility
Add Semrush Position Tracking for your 20 most important keywords. Run a site audit. Review competitor gaps monthly. Cost: $117 to $130/month. Time: 1 hour setup, 30 minutes weekly.
The 30-minute weekly review:
Open Databox or Looker Studio first. Check sessions, conversions, and cost per lead by channel. Open HubSpot second: new contacts this week, leads at each pipeline stage. Open Semrush last: ranking direction on your top keywords. That’s the whole review.
Common Mistakes Small Businesses Make With Marketing Dashboard Tools
- Setting up 5 tools at once and checking none of them.
Dashboard fatigue is real. Start with one marketing dashboard tool, get the review habit right, then add the next. A single dashboard you check every week beats five dashboards you open twice and abandon.
- Tracking the wrong metrics.
Sessions and impressions are activity metrics. The numbers that actually drive business decisions: cost per lead, leads by channel, pipeline conversion rate, and revenue attributable to marketing. If your dashboard doesn’t show those, rebuild it.
- Not setting up conversion events in GA4.
A GA4 account with no conversion events is almost useless for marketing analytics decisions. Traffic data without conversion data tells you what happened, not whether it mattered. Fix this before anything else.
- Paying for tools before exhausting free tiers.
GA4, Looker Studio, and HubSpot’s free CRM collectively cover more ground than most small businesses need in their first year. Don’t buy Databox or Semrush before you’ve hit the limits of what’s free.
- Building dashboards for reporting instead of decision-making.
A dashboard built to impress a stakeholder is full of green charts. A dashboard built to run a business shows what’s breaking: declining rankings, rising cost per lead, email lists shrinking. Good marketing dashboard tools show problems, not just progress.
- GA4 is the free, non-negotiable foundation for any small business marketing stack — without it, every other tool has a data gap.
- Looker Studio converts GA4 and Google Ads data into readable visual reports at zero cost.
- HubSpot's free CRM connects traffic to leads, showing which channels produce actual clients rather than just clicks.
- Databox consolidates 130+ data sources into one dashboard — worth adding once you run three or more paid channels.
- Semrush handles SEO and competitive intelligence that no other tool in the stack covers; add it once a content program is running.
Frequently Asked Questions
Is Google Analytics 4 enough for a small business marketing dashboard?
GA4 covers web analytics: traffic, behavior, and conversions. But it doesn't replace a CRM for lead tracking (that's HubSpot), a consolidated KPI view across paid channels (that's Databox), or SEO rank monitoring (that's Semrush). For most small businesses running two or more channels, GA4 is the foundation, not the complete stack.
What is the best free marketing dashboard tool for small businesses?
For web analytics, GA4 is the mandatory free foundation. For visual reporting over your Google data, Looker Studio (also free) is the best free option available. Together they give you a complete reporting setup at zero cost, enough for any small business in its first year of marketing analytics tracking.
How much should a small business spend on marketing analytics tools?
Year 1: $0. GA4, Looker Studio, and HubSpot's free CRM cover the essentials. Year 2, when running ads: $159/month for Databox. When publishing regular content: add Semrush at $117 to $130/month. A full stack runs roughly $280 to $290 per month, a spend that's justified once you're investing $2,000 or more per month in marketing and need data to optimize it.