
Eighty-seven percent of marketers say data-driven marketing is critical. Fewer than one in three trust the quality of their own data. Even fewer have a dashboard anyone still opens after the first week.
The data is not the problem. Most teams have more data than they can act on. The real problem is what happens before the first metric gets added to the screen. That’s where most marketing dashboards break.
One of the seven mistakes below appears in nearly every dashboard audit we run. It has nothing to do with chart types or color palettes. It comes down to a single question most teams never ask before building: what decision does this dashboard need to support?
Why Most Marketing Dashboards Get Abandoned (and What It Costs)
Marketing dashboard design fails in predictable patterns. The symptoms vary: low adoption, conflicting interpretations, stakeholders who ask for email updates instead of checking the live dashboard. But the root causes are consistent.
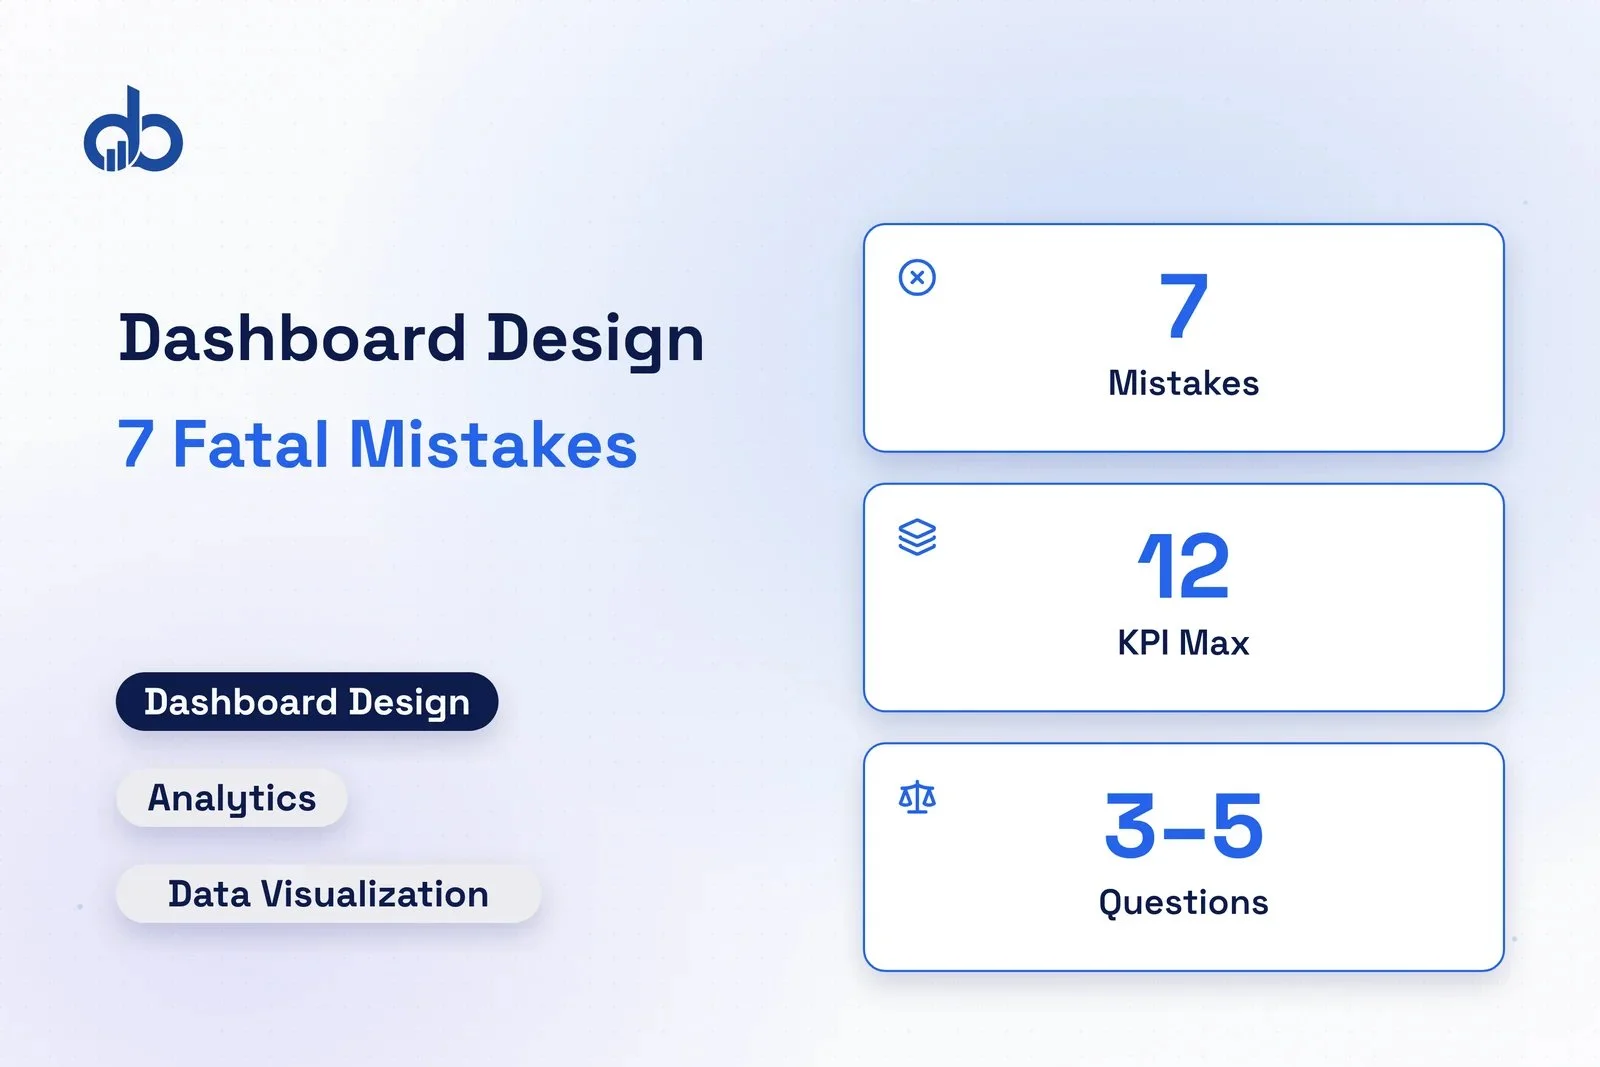
Here are the seven mistakes that appear most often:
- Mistake 1: Tracking everything and understanding nothing
- Mistake 2: Building for data availability instead of decision clarity
- Mistake 3: Displaying vanity metrics without context
- Mistake 4: Choosing the wrong chart type for the question
- Mistake 5: Designing only for desktop viewers
- Mistake 6: Building one dashboard for every role
- Mistake 7: Skipping real-time data and freshness indicators
Run through this list against your current dashboard. The number of dashboard mistakes that apply determines whether you need a tweak, a redesign, or a rebuild.
Mistake 1 — Tracking Everything and Understanding Nothing
The most common failure in marketing dashboard design starts with the right instinct. The team wants visibility. So they add a tile for every metric they have access to: sessions, bounce rate, conversion rate, cost per click, impressions, followers, email open rate, click-through rate, page depth, scroll depth, and more.
The dashboard fills up fast. In a demo, it looks impressive. In daily use, nobody can answer the simplest question: should we increase spend on this channel this week?
Working memory can process 5–9 distinct elements at once. Dashboards that exceed 12 KPIs show 40% lower engagement than dashboards with focused metric sets. That engagement gap is a decision gap: the team scrolls past the metrics that matter because there is no visual hierarchy to stop them. (UXPin Dashboard Design Principles)
When too many metrics compete for attention, the team defaults to the ones they already understand: usually the easiest ones to explain, not the most important ones to act on. The other metrics become wallpaper.
The fix: Build separate dashboard views by decision type, not by data source. A campaign performance view needs 6–8 metrics. A channel health overview needs 4–6. An executive summary needs 3–5. No single view should exceed 12 metrics.
Not sure which metrics your team actually uses to make decisions? Get Free Marketing Audit
Mistake 2 — Building for Data Availability Instead of Decision Clarity
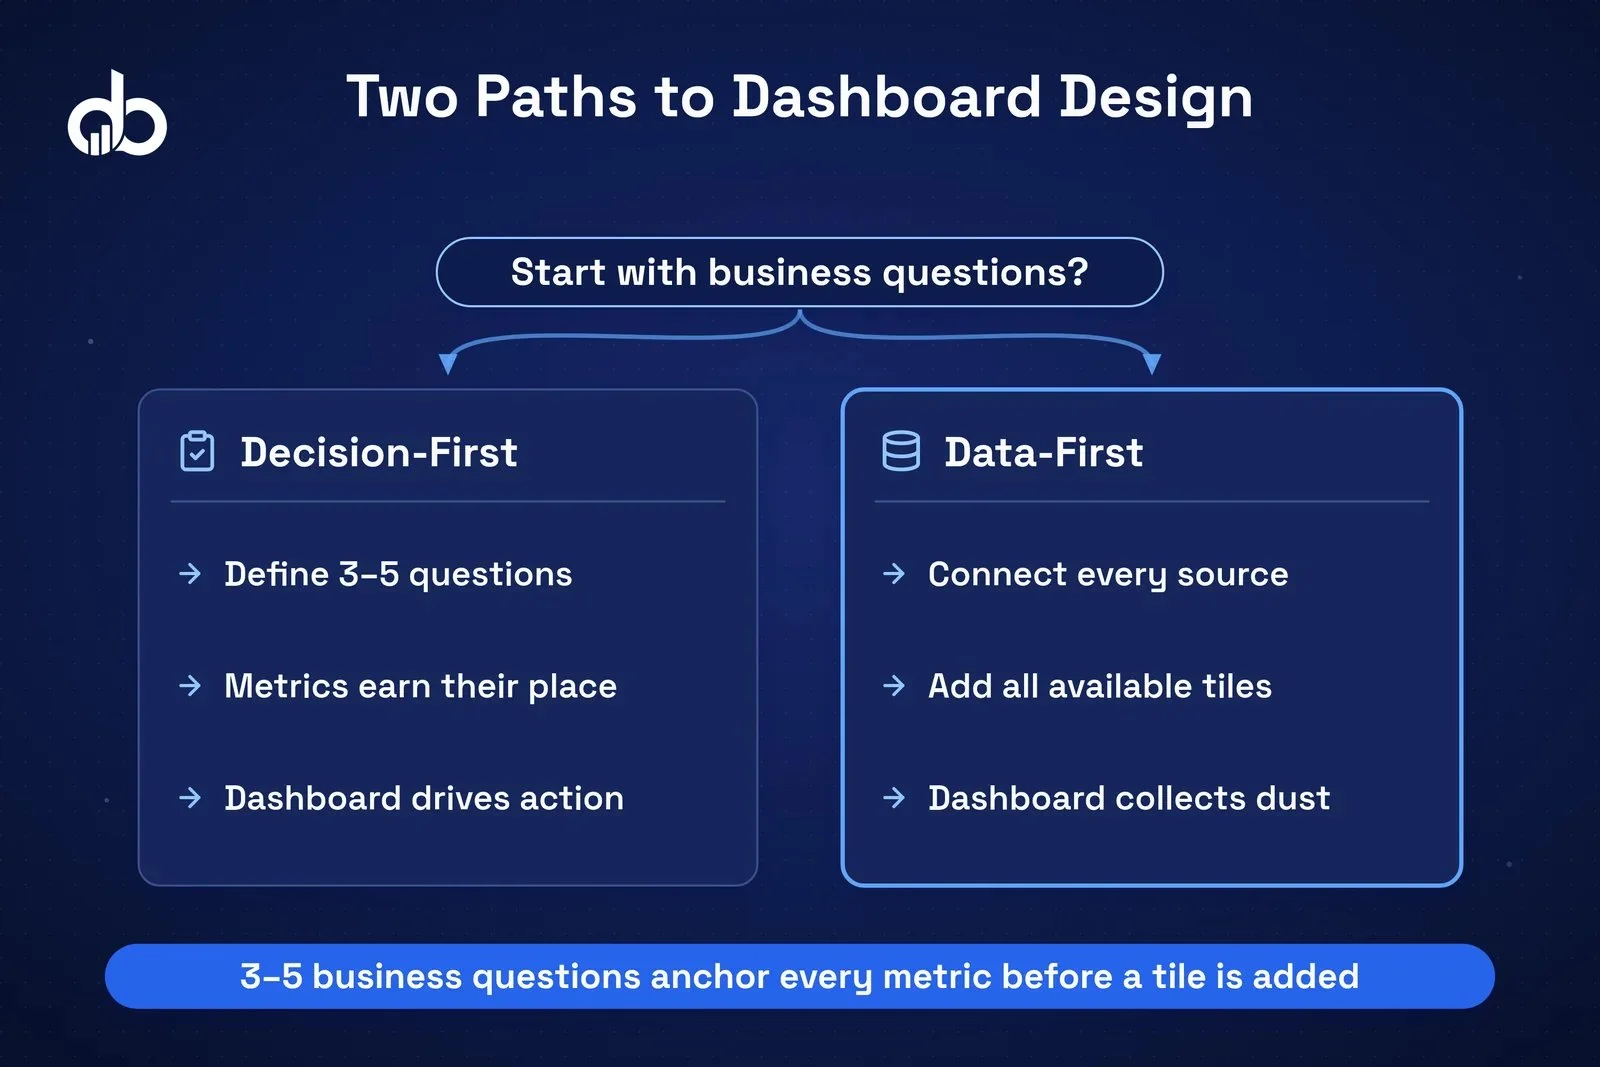
This is the mistake that sits underneath every other mistake on this list.
When a marketing team starts building a dashboard by connecting every data source they have access to, the end result looks thorough. Twelve platforms feeding into a single view. Color-coded tiles. Auto-refreshing charts for every metric the API exposes.
In practice, nobody can look at it and answer: “Should we shift budget from SEO to paid this quarter?”
The data is there. The clarity isn’t. And the gap between those two things is where most marketing analytics investment goes to waste.
A 2026 survey found that 60% of marketing professionals report their current dashboard doesn’t provide the insights they need to make informed decisions. That’s not a data problem: those teams have data. It’s a design problem.
The teams whose dashboards actually drive decisions start the same process differently. Before connecting a single data source, they write down three to five business questions the dashboard must be able to answer. Those questions become the filter for every metric that gets added.
Every metric on the dashboard earns its place by answering one of those questions. Metrics that don’t answer any of them get moved to a secondary reporting view or removed entirely.
The fix: Before your next dashboard build or redesign, write the three to five business questions first. Hold every metric to that standard:
- Is our paid acquisition cost trending toward or away from our target CAC?
- Which content pieces are driving the highest lead conversion rates this month?
- Is our email nurture sequence moving contacts through the funnel faster than last quarter?
This framing shift is the difference between marketing analytics that report what happened and marketing analytics that drive what happens next.
Mistake 3 — Displaying Vanity Metrics Without Context
The dashboard shows 14,200 Instagram followers. 4.1% average email open rate. 210,000 monthly page views. A business owner looks at those numbers, feels good about the direction of things, and closes the tab.
None of those numbers told them anything useful.
Data visualization is critical to marketing decision-making: 70% of marketers report that the way data is displayed directly affects which decisions get made. The problem isn’t the display. The problem is choosing the wrong thing to display.
Most marketing dashboards track 30–50 metrics. Most decisions get made by looking at three. The gap between what’s displayed and what’s used is where reporting effort disappears.
The fix: Replace each vanity metric with its decision equivalent:
| Vanity Metric | Decision Equivalent | What It Tells You |
|---|---|---|
| Total followers | Follower growth rate vs. benchmark | Whether your audience-building is accelerating |
| Monthly page views | Page-to-lead conversion rate | Whether traffic is doing its job |
| Email open rate | Email click-to-conversion rate | Whether opens lead to revenue |
| Impressions | Cost per qualified lead | Whether awareness spend is generating pipeline |
| Bounce rate | Scroll depth + exit page | Where in the content the reader disengages |
The right metric doesn’t need to be impressive. It needs to answer the decision the stakeholder is trying to make. Effective data visualization starts with the right metric choice, not the right chart type.
Unsure which metrics in your current reporting setup actually drive decisions? Get Free Marketing Audit
Mistake 4 — Choosing the Wrong Chart Type for the Question
Dashboard design research consistently identifies chart type mismatches as the leading cause of data misinterpretation. The data is correct. The chart makes it unreadable, or worse, misleading.
The most common offenders:
- A pie chart for campaign performance over six months. Pie charts show composition: parts of a whole at a single point in time. They cannot show change. A trend line would show the same data in a format that actually answers whether performance is improving.
- A bar chart for showing the relationship between two continuous variables, like spend and revenue over time. Bar charts compare discrete categories. A scatter plot or line chart shows the relationship clearly.
- A single number tile (without trend or benchmark) for a metric like conversion rate. Seeing “3.2%” means nothing without knowing whether 3.2% is good for this channel and whether it’s moving up or down. A sparkline or comparison period turns it from a number into information.
The problem with wrong chart selection in marketing dashboard design isn’t aesthetic. It’s that stakeholders start making decisions based on what they can read easily, not what the data actually says.
Three rules for chart selection: use bar or column charts for comparison across categories; use line charts for changes over time; use tables when you need exact values and your audience needs to compare multiple dimensions at once. If a chart type is making you simplify the data to fit it, you have the wrong chart type.
The fix: Before building any visualization in your marketing dashboard, define the question the chart needs to answer. The answer to that question determines the chart type, not the tools available in your dashboard platform.
Mistake 5 — Designing Only for Desktop Viewers
The dashboard went through two rounds of internal review. The layout looks clean. The metric hierarchy is logical. The color coding is consistent.
Then the CMO opens it on a tablet during a board meeting. The axis labels are too small to read without zooming. The chart grid collapses into a single column. The scroll is three pages deep before the summary metrics appear.
Mobile access to marketing dashboards isn’t a nice-to-have. Seventy-eight percent of marketing technology stacks are siloed across platforms. The executives who need to reconcile data from those siloed tools are doing it on mobile between meetings, not at a desktop.
A dashboard nobody can read on a phone is a dashboard that stops being checked.
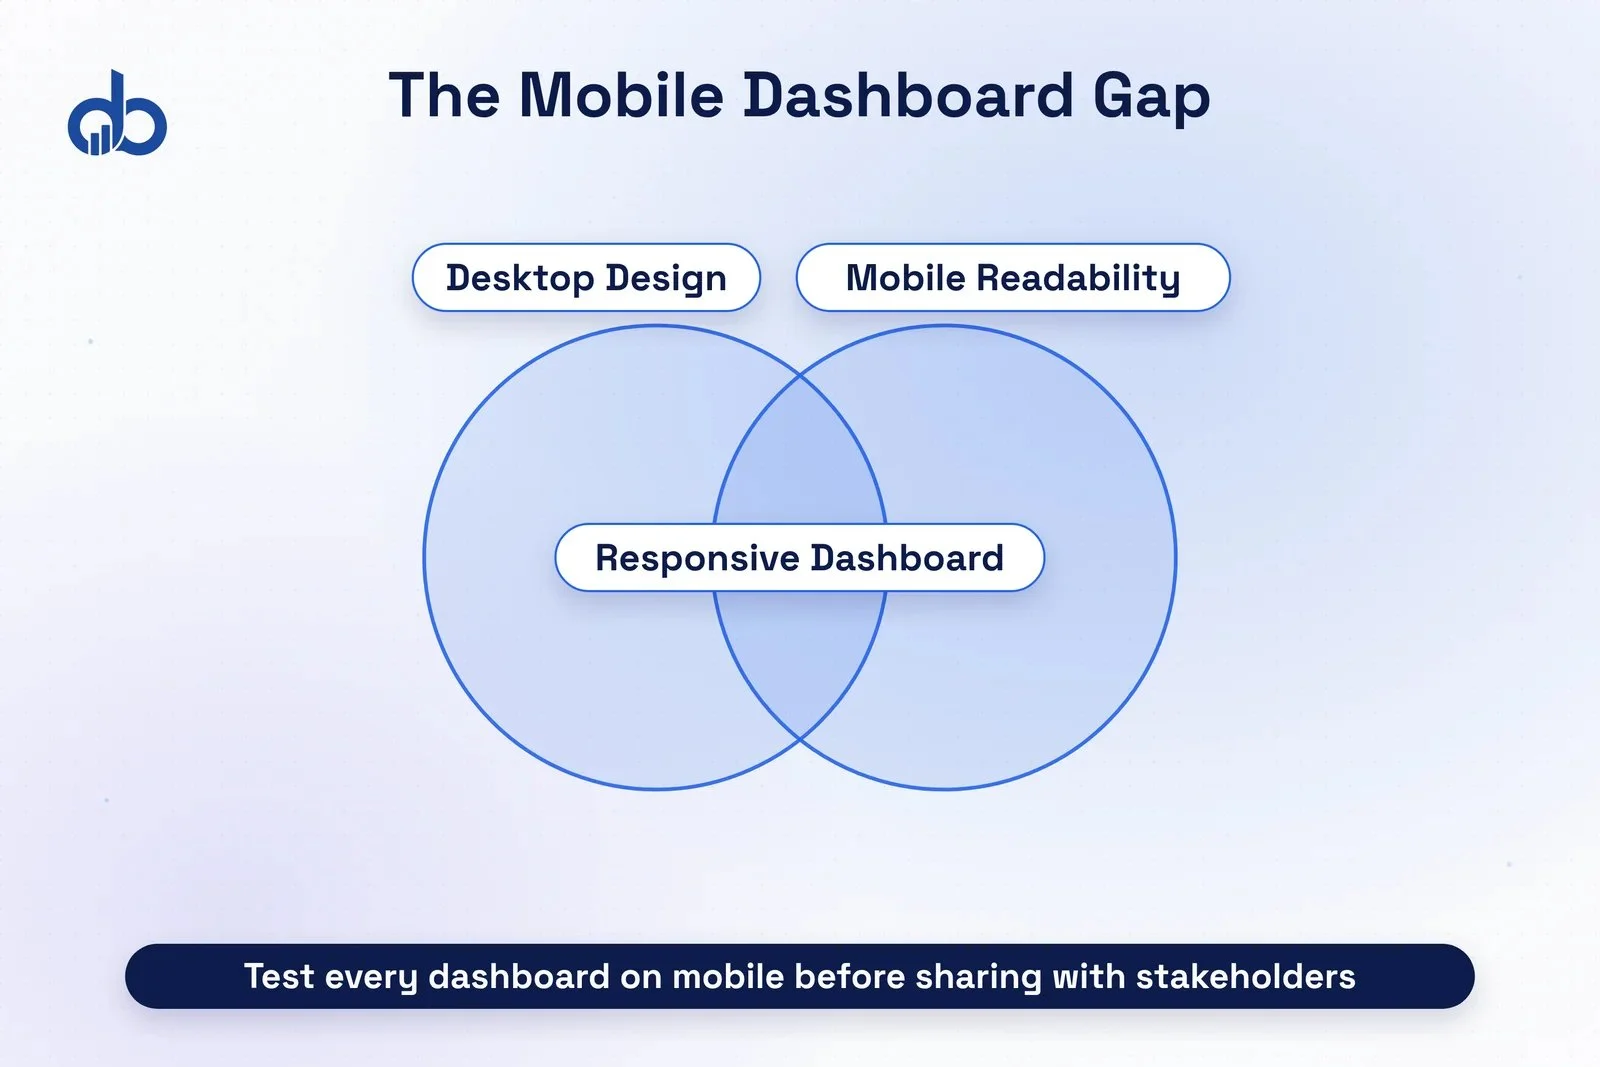
The mistake isn’t designing for desktop. The mistake is designing for desktop only and skipping the mobile validation step before launch.
The fix: Before sharing any dashboard with stakeholders, test it on a phone and a tablet. The mobile view should surface 3–4 critical KPIs without scrolling. Charts should render at a size that doesn’t require zooming to read the axis labels.
Mobile-first marketing dashboard design means deciding which 3–4 metrics matter enough to survive the most constrained screen, then building from that constraint outward.
Mistake 6 — Building One Dashboard for Every Role
One dashboard. One link. Sent to everyone: the CMO, the performance marketer, the content team, the CEO, the client.
The CEO needs weekly revenue impact and trend direction. The performance marketer needs hourly campaign data by ad set. The content team needs monthly traffic and conversion rates by page. The client needs a clean view of the metrics you agreed to move.
When one dashboard tries to serve all of them, the design ends up serving none of them well. The CEO reads campaign-level detail they can’t interpret. The performance marketer can’t find the granular data buried under executive-level summary tiles.
Customization isn’t a luxury in marketing analytics. It’s the difference between a stakeholder who checks the dashboard before their Monday meeting and one who emails asking for a manual update.
The fix: Build role-specific views from the same underlying data source. Four views that cover most marketing teams:
- Executive View: 4–5 metrics, weekly refresh, revenue-connected (CAC, MQL volume, pipeline contribution, marketing ROI).
- Campaign Manager View: 8–10 metrics, daily or hourly refresh, channel-specific (spend by channel, ROAS by campaign, conversion rate by ad set, CPC trends).
- CMO View: 6–8 metrics, weekly refresh, trend and channel health (all-channel performance, budget pacing, YoY comparison, revenue attribution).
- Client Reporting View: 5–7 agreed KPIs, monthly refresh, clean formatting with MTD and YoY comparison built in.
Each view pulls from the same marketing analytics data; the difference is the depth, the cadence, and the decision context built into each one.
Building dashboards your team will actually use requires starting with the right framework. Get Free Marketing Audit
Mistake 7 — Skipping Real-Time Data and Freshness Indicators
The campaign has been live for 12 hours. The performance marketer checks the dashboard, sees green across all metrics, and decides to increase the budget on the top-performing ad set.
The dashboard is pulling yesterday’s data.
That ad set started underperforming six hours ago. The quality score dropped. The CPM spiked. The conversion rate fell below threshold. None of that is visible on a dashboard showing data from 24 hours ago.
Budget gets allocated in the wrong direction. The damage compounds before the next refresh cycle catches it.
Stale data isn’t just an inconvenience. It actively leads to wrong decisions. And yet most marketing dashboards launch without data freshness timestamps, with no indication of whether you’re looking at live data or last week’s snapshot.
AI-powered marketing dashboard tools have made real-time anomaly detection accessible to teams that couldn’t build it from scratch. These tools surface unusual changes in metrics before you’d notice them in a manual review.
The fix: Add data freshness timestamps to every dashboard view. “Last updated: 4 minutes ago” changes how stakeholders read and trust the data. Set update frequencies matched to decision cadence:
- Active campaigns: hourly minimum, real-time for high-spend periods
- Performance monitoring: daily
- Executive and client reporting: weekly or per agreed cadence
Every dashboard view should make it immediately clear when the data was last refreshed. If your current dashboard doesn’t show this, add it before your next stakeholder review.
Your Marketing Dashboard Recovery Plan
Identifying the dashboard mistakes is the first step. Fixing them in the right order saves time and prevents rebuilding the same problems into a new layout.
Priority sequence (start here):
- Audit your metric list first. Count every metric on your current dashboard. If it exceeds 12 per view, list them in order of how often they inform a real decision. Cut everything below the line.
- Define the business questions. Before adjusting a single metric, write the three to five business questions your dashboard must be able to answer. Hold every remaining metric to that standard.
- Replace the top three vanity metrics. Identify which metrics look impressive but don’t inform a decision. Swap them for their decision equivalents using the table above.
- Add data freshness timestamps today. This takes 10 minutes in most dashboard platforms and immediately changes how stakeholders interpret what they see.
- Build one additional role-specific view. Identify your most important non-marketing stakeholder. Build a view designed for their question: not a simplified version of the marketing view, but a view that answers the single question they always ask.
Want an analytics team to run this audit for you? Get Free Marketing Audit
The Marketing Dashboard Self-Assessment
Review your current dashboard against the 7 dashboard mistakes. Mark each one that applies:
- My dashboard has more than 12 metrics per view with no clear hierarchy (Mistake 1)
- The metrics were chosen based on available data, not defined business questions (Mistake 2)
- More than half my metrics are engagement-level rather than decision-level (Mistake 3)
- I have charts that require explanation before a stakeholder can read them (Mistake 4)
- The dashboard hasn’t been tested on mobile or tablet (Mistake 5)
- The same dashboard link goes to both the CEO and the performance manager (Mistake 6)
- There’s no data freshness timestamp on any view (Mistake 7)
Your score:
- 0–2 mistakes: Dashboard is well-structured. Focus on deepening role-specific views and testing adoption.
- 3–4 mistakes: Moderate redesign needed. Start with the metric audit and business question anchoring; those two fixes address most downstream issues.
- 5–7 mistakes: A rebuild is more efficient than patching. Start from the business questions, not the data sources.
A Marketing Dashboard That Nobody Opens Isn’t a Dashboard
You can now identify which of the seven dashboard mistakes applies to your current setup. You have a recovery sequence that addresses the root cause first, not just the surface symptoms. The gap between knowing these mistakes and fixing them is real. The redesign work happens in the conversations with stakeholders, the metric selection process, and the business question definition that most teams skip.
That’s the work our Analytics & Tracking service is built around. If you’re building a dashboard from scratch rather than fixing an existing one, our Beginner’s Guide to Creating a Marketing Dashboard walks through the build process from the first stakeholder question to the final published view.
Is your marketing dashboard telling you what you need to know? Our analytics team audits your current reporting setup and rebuilds dashboards your team will use every day. Get Free Marketing Audit
- Dashboards fail when they're built around data availability rather than specific business questions — write the questions first, then select metrics.
- Limit each dashboard view to 12 metrics or fewer; dashboards exceeding this show 40% lower engagement from stakeholders.
- Replace vanity metrics (followers, impressions, page views) with decision equivalents (follower growth rate, cost per qualified lead, page-to-lead conversion rate).
- Match chart type to the business question: bar charts for category comparison, line charts for trends over time, tables for multi-dimensional exact values.
- Build role-specific views for executives, campaign managers, CMOs, and clients — one dashboard cannot serve all four effectively.
- Add data freshness timestamps to every view and set update frequencies matched to each stakeholder's decision cadence.
Frequently Asked Questions
What is the most common marketing dashboard design mistake?
The most common mistake is metric overload — adding every available metric instead of limiting each view to 6–12 KPIs tied to specific business questions. Dashboards with focused metric sets see 40% higher engagement than those tracking 20 or more metrics per view.
How many metrics should a marketing dashboard have per view?
Each dashboard view should have no more than 12 metrics, with most effective views using 4–8. Campaign performance views work well with 6–8 metrics, executive summaries need only 3–5, and channel health overviews typically need 4–6. No single view should exceed 12.
Why do most marketing dashboards fail to drive decisions?
Most dashboards are built around data availability rather than business questions. When teams connect every platform they have access to before defining what decisions the dashboard must support, the result is data that answers no specific question. A 2026 survey found 60% of marketing professionals report their dashboard doesn't provide the insights they need.
What is the difference between vanity metrics and decision metrics?
Vanity metrics look impressive but don't inform decisions — total followers, monthly page views, impressions, email open rate. Decision metrics answer a specific business question: follower growth rate vs. benchmark tells you whether audience-building is accelerating; page-to-lead conversion rate tells you whether traffic is doing its job; cost per qualified lead tells you whether awareness spend is generating pipeline.
How often should marketing dashboard data be updated?
Update frequency should match decision cadence. Active campaigns need hourly minimum refresh, with real-time data during high-spend periods. Performance monitoring dashboards should update daily. Executive and client reporting views update weekly or per the agreed reporting cadence. Every view should display a data freshness timestamp showing when data was last refreshed.