
Eighty-seven percent of marketers say data-driven marketing is critical to their success. But only 32% trust the quality of their own data, and even fewer have a marketing dashboard they actually open every day.
Here’s the thing: that gap isn’t a data problem. It’s a setup problem.
If you’ve ever built a reporting view that ended up forgotten in a browser tab, you’re definitely not alone. Most marketing dashboards fail within 90 days. Not because of bad data, but because they were built the wrong way. Too many metrics, no clear hierarchy, no reason for anyone to act.
This guide fixes that. You’ll learn how to create a marketing dashboard that people actually use: what to measure, how to connect your data, which tools work for beginners, and the one setup step that most guides skip entirely.
What Is a Marketing Dashboard (and What It’s Not)
A marketing dashboard is a live, centralized view of your key marketing performance metrics across channels, updated automatically so you’re not pulling data manually every week.
It is NOT:
- A static spreadsheet report you update by copy-pasting from Google Ads and GA4
- The native dashboard inside your ad platform (that only shows one channel)
- A full business intelligence tool built for data analysts
The distinction matters. A lot. Most beginners confuse a marketing dashboard with one of these alternatives and either underbuild (a shared Google Sheet with formulas that break every Monday) or overbuild (a Tableau setup that requires a full-time analyst to maintain).
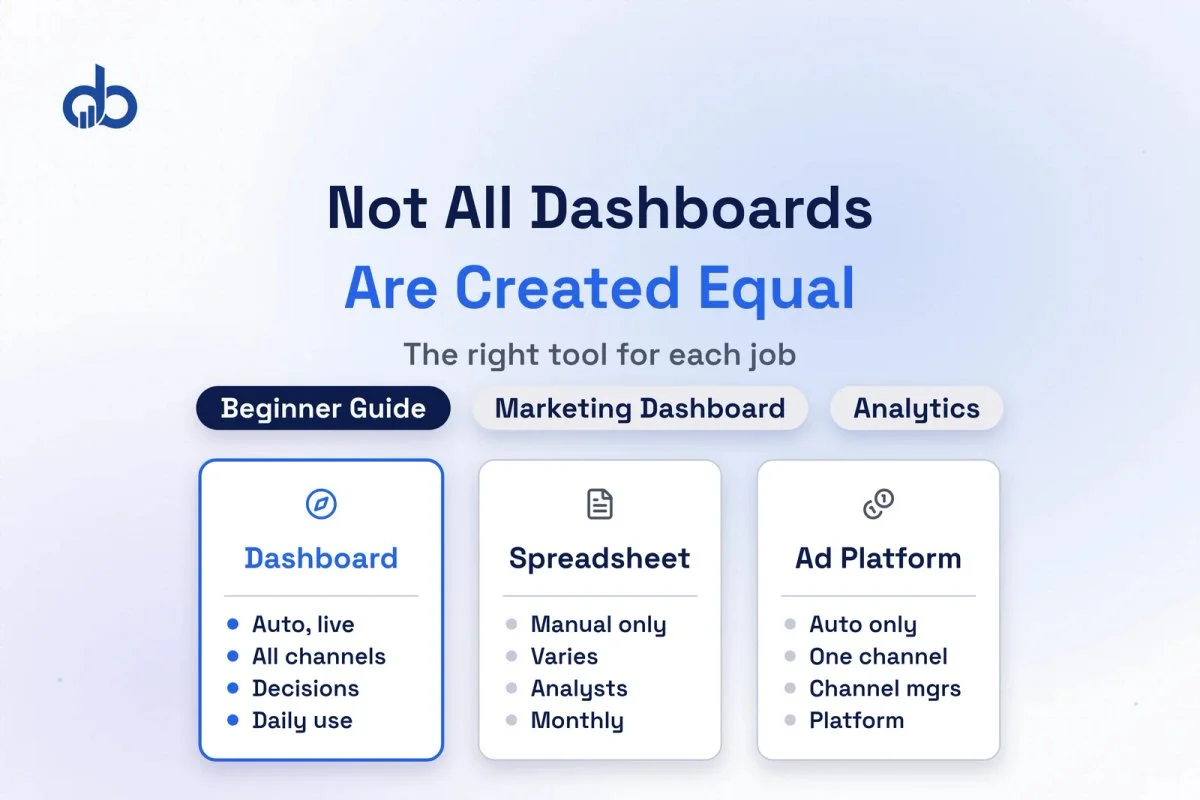
| Marketing Dashboard | Spreadsheet Report | Ad Platform Dashboard | |
|---|---|---|---|
| Updates | Automatic (live) | Manual | Automatic |
| Channels | All channels, unified | Varies | One platform only |
| Audience | Decision-makers | Analyst/ops | Channel manager |
| Best for | Daily/weekly decisions | Monthly deep dives | Platform-level optimization |
A good Analytics & Tracking setup feeds your marketing dashboard automatically. No manual exports, no formula errors, no stale numbers from last Tuesday.
The average marketing team now works across 8 to 15 platforms. Without a unified marketing dashboard, performance data stays siloed. Google Ads in one tab, Meta in another, email metrics in a third. Nobody sees the full picture, and decisions get made on incomplete information.
That’s a recipe for wasted budget.
Why Most Marketing Dashboards Fail Within 90 Days (And How to Avoid It)
This section is the one most beginner guides skip entirely. Understanding why dashboards get abandoned is actually more valuable than learning how to build one. Because if you build it wrong, it doesn’t matter how many data sources you’ve connected.
There are three failure modes that kill marketing dashboards before they reach their 90-day mark.
Failure Mode 1: Too Many Metrics, No Visual Hierarchy
Faced with 30 indicators on a single screen, marketing teams treat them all as equally important and end up acting on none of them with confidence. A dashboard that shows everything effectively shows nothing. When every metric gets equal visual weight, the important ones don’t stand out.
Failure Mode 2: No Decision Triggers
A dashboard without action thresholds is just a display. If your cost per lead rises 30% week-over-week, does your dashboard tell you that? Does it prompt any action? Most marketing dashboards show data but don’t tell you what that data means. The fix is adding decision triggers: thresholds that signal when something needs attention.
Failure Mode 3: Built for the Analyst, Not the Decision-Maker
Dashboards built for completeness get used by the person who built them. Nobody else opens them. Dashboards built around 3 to 5 decisions get opened by leadership every week. A dashboard designed for the CMO should not look like the one designed for the paid search manager. Audience determines what gets shown.
Keep these three failure modes in front of you as you build. Every design choice should answer one question: does this help someone make a decision, or does it just display data?
Step 1: Define What Decisions Your Dashboard Needs to Drive
Before you even think about picking a tool or choosing your first metric, answer three questions:
- Who will use this dashboard?
- What decisions will they make with it?
- How often will they review it?
The answers determine everything else. A weekly executive review needs completely different metrics than a daily campaign check-in.
| Dashboard Type | Audience | Review Cadence | Core Focus |
|---|---|---|---|
| Executive | CEO, CMO, founders | Weekly | Revenue, CAC, ROI, pipeline |
| Channel | Marketing managers | Daily/weekly | Traffic, leads, conversion rate |
| Campaign | Paid media team | Daily | Spend, ROAS, CPA, lead volume |
Start with one audience. Build one dashboard for them. Most beginners try to build a single dashboard that works for everyone. It ends up working for no one.
Write down three literal questions your marketing dashboard must answer:
- “Are we on track to hit our lead target this month?”
- “Which channel is delivering the lowest cost per lead right now?”
- “Is our ROAS holding above 2.5?”
If your dashboard can’t answer those questions at a glance, it’s not finished yet.
Step 2: Choose Your Marketing KPIs (The Right Ones)
KPI selection is where most beginner dashboards go wrong. The temptation is to add every metric available: impressions, followers, session duration, bounce rate, email open rate, and 20 more. The result is a dashboard nobody opens.
The rule is simple: 3 to 5 KPIs per audience level, each tied to a specific business outcome.
Here’s how to separate decision metrics from vanity metrics:
| Vanity Metric | Decision Metric |
|---|---|
| Impressions | Cost per qualified lead |
| Followers | Email-sourced pipeline |
| Page views | Demo request conversion rate |
| Email opens | Revenue influenced by email |
| Social reach | Lead-to-customer rate |
Vanity metrics measure activity. Decision metrics measure results. A marketing dashboard built on vanity metrics gives you no real information about whether your marketing is actually working.
These marketing KPIs sit at the core of your entire marketing analytics practice. They’re not just reporting numbers. They’re the inputs your team uses to allocate budget, shift strategy, and justify spend to leadership.
Four KPI categories for beginners:
Acquisition: How many people are you reaching and converting to leads?
- Sessions, leads generated, cost per lead, click-through rate
Conversion: How efficiently are you turning interest into action?
- Conversion rate, cost per lead, trial start rate, form completion rate
Revenue: What is your marketing activity worth financially?
- ROAS, CAC, LTV, marketing-sourced revenue
Retention/Engagement: Are existing customers and leads staying engaged?
- Email open rate, unsubscribe rate, return visitor rate
For a first marketing dashboard, pick one metric from Acquisition and one from Revenue. Add a Conversion metric if you’re running paid campaigns. That’s your starting set: three marketing KPIs. You can always add more once the dashboard is actually in regular use.
Step 3: Connect Your Data Sources
A marketing dashboard is only as good as the data flowing into it. Marketing analytics only works when your data sources are connected and consistent. And this is where 61% of marketing teams run into their biggest challenge: cross-channel attribution and data integration.
Here’s a map of the most common data sources by category:
Web Analytics
- Google Analytics 4: sessions, conversions, traffic source, user behavior
Paid Advertising
- Google Ads: spend, clicks, impressions, ROAS, CPA
- Meta Ads: reach, CPM, CTR, lead volume
- LinkedIn Ads (B2B): impressions, MQLs, cost per lead
Email Marketing
- Mailchimp, HubSpot, Klaviyo: open rate, click rate, unsubscribes, revenue per email
CRM
- HubSpot, Salesforce, Pipedrive: leads by source, deal stage, closed revenue
SEO
- Google Search Console: impressions, clicks, average position
- Semrush / Ahrefs: keyword rankings, organic traffic trends
You don’t need all of these on Day 1. Seriously. Start with Google Analytics 4 and one paid advertising platform. Verify that data is flowing correctly before adding more sources. A dashboard showing two accurate metrics is far more useful than one showing 20 unreliable ones.
The cross-channel attribution challenge: when a lead first finds you through organic search, clicks a retargeting ad, and then converts through an email campaign, which channel gets credit? Most basic dashboard tools use last-click attribution by default. For beginners, that’s fine as a starting point. Just know that last-click attribution systematically undervalues upper-funnel channels like organic search and social.
Good data visualization starts with clean data. If your sources use different date ranges, different conversion definitions, or different audience segmentations, your dashboard will show contradictory numbers. Align these definitions before you build anything.
Step 4: Choose the Right Dashboard Tool for Your Needs
You don’t need an expensive platform to build a functional marketing dashboard. The right tool depends on your budget, your data sources, and how technical you’re willing to get.
Looker Studio (Google Looker Studio): Best for beginners in the Google ecosystem
Free. Connects natively to GA4, Google Ads, Search Console, and YouTube. Strong for data visualization with drag-and-drop chart building. The limitation: it doesn’t clean or transform data, so blending messy multi-source data requires some manual work.
Databox: Best for teams wanting fast setup with templates
100+ native integrations. Pre-built dashboard templates for Google Ads, Facebook Ads, HubSpot, and more. Gets you from signup to a working dashboard in under an hour. Paid plans start at $159/month after a limited free tier (3 data sources, 1 dashboard).
HubSpot Dashboards: Best for teams already using HubSpot
If your CRM and email marketing are already in HubSpot, their built-in dashboards give you marketing KPIs without any additional integration. Limited for teams using non-HubSpot channels.
Whatagraph / Swydo: Best for agencies reporting to clients
Strong on automated client-facing reports. Overkill for internal dashboards at small businesses.
Decision rule for beginners: start with Looker Studio if you’re primarily using Google’s tools and want zero cost. Move to a paid tool when you’re managing paid advertising across multiple platforms or when you need automated client-ready reports.
Step 5: Design Your Dashboard Layout
Data visualization is where most beginner dashboards become unreadable. A well-structured layout turns raw marketing analytics data into something a non-analyst can actually read and act on. The goal of layout design isn’t to display everything. It’s to guide the viewer’s eye from the most important information down to the supporting detail.
Three-section layout:
-
Top section: Headline numbers. Your 3 to 5 core marketing KPIs displayed as large, scannable tiles. This is what a decision-maker sees in the first three seconds.
-
Middle section: Channel or campaign breakdown. How each channel is contributing to the headline numbers. Bar charts, line charts, and trend comparisons live here.
-
Bottom section: Supporting detail. Audience data, device breakdowns, keyword performance, campaign-level spend. This is where analysts dig deeper.
Design rules:
- Limit to 3 to 4 colors per dashboard. More colors create visual noise and reduce accessibility.
- Use the same date range across all charts. Mixing time periods on the same screen makes comparison impossible.
- Label every axis and every chart. “Clicks” means different things on different platforms, so label it clearly.
- Set a default comparison: this month vs. the same period last month.
What to avoid:
- 3D charts (they distort proportions)
- More than 20 metrics on a single view
- Mixing attribution models across charts on the same dashboard
Step 6: Set Up Alerts and Decision Triggers
This is the step most beginner guides don’t include. And it’s honestly the one that makes the biggest difference between a marketing dashboard that gets opened every day and one that gets ignored.
Alerts transform your marketing dashboard from a passive display into an active decision tool. Instead of logging in and hoping nothing has gone wrong, alerts tell you when something actually needs your attention.
Three decision triggers every beginner should set:
Performance drop alert: ROAS falls below your minimum threshold (e.g., 2.0). Action: review campaign budgets and creative.
Cost spike alert: Cost per lead rises 20%+ week-over-week. Action: investigate channel quality, check for bid changes or increased competition.
Engagement signal: Email open rate drops below 20%. Action: review list health, check for deliverability issues, evaluate subject lines.
Most marketing analytics tools support basic alerts. In Looker Studio, set up scheduled email reports. In Databox, configure metric alerts with custom thresholds. GA4 supports custom alerts under Admin > Custom Alerts.
The key mindset shift here: a decision trigger isn’t “notify me when something changes.” It’s “notify me when something changes enough that I need to act.” Define the threshold before you set the alert.
Not sure which metrics your marketing dashboard should track? Our analytics team audits your current setup, identifies tracking gaps, and builds a reporting structure that connects marketing activity to revenue, not just traffic. Get Free Marketing Audit
Your First Marketing Dashboard in 30 Days: A Practical Timeline
Thirty days is enough to go from zero to a working marketing dashboard you’ll actually use. Here’s a week-by-week plan that avoids the common traps.
Week 1: Define Before You Build
Write down three questions your dashboard must answer. Identify your primary audience (you, your team, your leadership?). List your two most important data sources. Don’t even open a dashboard tool yet. This week is all about clarity.
Week 2: Connect and Verify Data
Connect your first data source (start with GA4 or your primary ad platform). Build one simple view: total sessions or total conversions. Verify the numbers match what you see in the native platform. Fix any discrepancies before adding more data. Data accuracy isn’t negotiable.
Week 3: Build and Design
Add your 3 to 5 marketing KPIs. Apply the three-section layout (headlines, channels, detail). Limit colors to three. Set a default date comparison. Set up one performance alert.
Week 4: Share and Iterate
Share the dashboard with one other person. Ask them a simple question: “Can you answer your top question within 10 seconds of opening this?” If they can’t, remove metrics rather than adding them. Create a marketing dashboard that serves fewer people better, not more people poorly.
After 30 days, you’ll have a baseline. Month 2 is about adding one new data source or metric based on what you’re still not able to answer. Month 3 is about refining: removing anything that hasn’t been referenced in an actual decision.
- A marketing dashboard is a live, centralized view of KPIs across channels — not a static spreadsheet or single-platform report.
- Most dashboards fail within 90 days due to metric overload, no decision triggers, and being built for analysts instead of decision-makers.
- Choose 3 to 5 KPIs per audience level, focused on decision metrics (cost per lead, ROAS) not vanity metrics (impressions, followers).
- Start with GA4 and one paid channel; add data sources gradually rather than trying to connect everything on day one.
- Set up decision triggers — specific thresholds that prompt action — not just passive displays of numbers.
- A 30-day build plan (define, connect, build, share) is enough to create a dashboard your team will actually use.
Frequently Asked Questions
What is the best free marketing dashboard tool?
Looker Studio (formerly Google Data Studio) is the best free option for most beginners. It connects natively to GA4, Google Ads, and Search Console at zero cost. The main limitation is that it requires some manual work when blending data from non-Google sources.
How many metrics should a marketing dashboard have?
For a beginner's marketing dashboard, start with 5 to 8 metrics total. At the executive level, 3 to 5 headline KPIs is the right range. Research on dashboard usability consistently shows that decision quality drops when more than 7 metrics are displayed on a single view. Start small and add only what you reference in actual decisions.
How often should I update my marketing dashboard?
If you're connecting live data sources, your marketing dashboard updates automatically. For beginners, reviewing it weekly is the right cadence. Daily review is only useful once you're running active paid campaigns that need frequent optimization. Scheduled email reports (via Looker Studio or Databox) are the best way to build a consistent review habit.
Do I need a marketing dashboard if I have a small business?
Yes, especially if you're running any paid advertising. Without a unified view, it's easy to overspend on an underperforming channel while underinvesting in one that's working. Even a simple marketing dashboard with 5 metrics (total leads, cost per lead, conversion rate, email opens, and ROAS) gives you far more decision-making clarity than logging into three separate platforms every morning.
What's the difference between a marketing dashboard and a report?
A marketing dashboard is live and ongoing. It shows current performance at a glance, updated automatically. A report is a snapshot, usually exported at a fixed point in time, with more narrative context and analysis added manually. Dashboards are for daily and weekly monitoring. Reports are for monthly reviews, stakeholder presentations, and deeper analysis.